
Retail Definitions:
Inventory Turnover
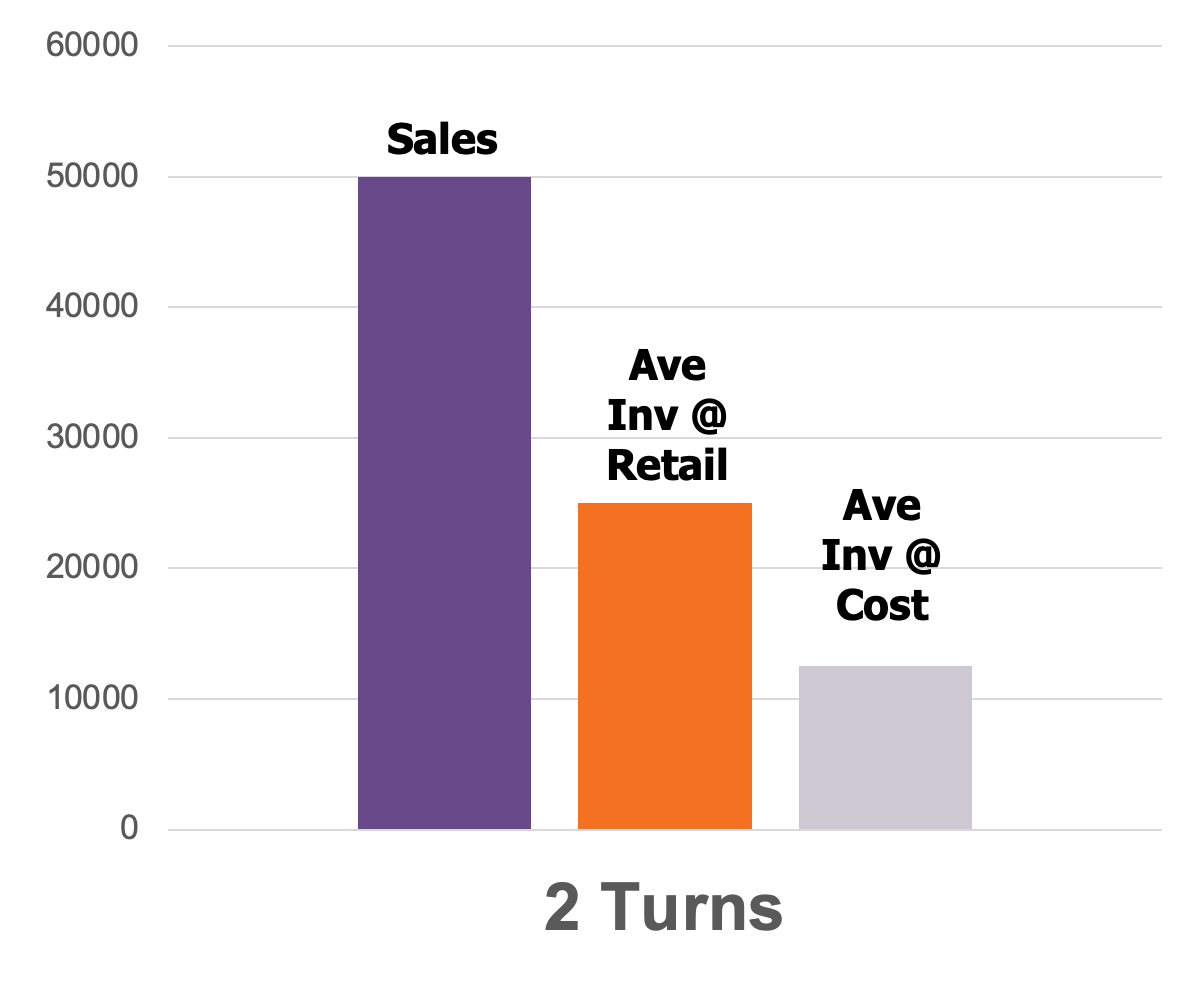
Inventory turnover in retail shows the number of times that your inventory is sold within a given period of time—normally one year. Setting and achieving an optimum retail turnover goal is extremely important to your profit and overall success.
In the example graph here, the retailer has about $25,000 worth of inventory in any given month. They sell $50,000 with of inventory in a year. This means that, in that year, they sell their average inventory twice over (because 25 x 2 = 50).

What’s the “right” turnover? That could depend on what you’re selling, at what cost, and at what volume. By analyzing trends in your retail data expressed through Retail ORBIT®, our certified M1 Retail Experts can offer knowledgeable advice on achieving the turnover that’s right for your business, your growth, and your goals.
Turn has implications for all kinds of retail success metrics, but the easiest way of understanding why it's so important is to imagine two scenarios.
In scenario 1 (in the example below), a retailer does $50,000 in sales, but owns about $50,000 in inventory at any given time. In scenario 2, a retailer does exactly the same amount of sales—$50,000—but only owns $25,000 worth of inventory at any given time.